01 Aug 2024, by Calum Shepherd
I set out to answer the question ‘what are the qualities of a good product strategy?’
We all aim to create strategies that are well understood, enabling colleagues to feel comfortable socialising them. But how exactly do we achieve that?
It felt like strategies should have some consistent qualities. If we get those right, we can free up time to focus on the what of the strategy.
So, I spent some time researching.
This post covers
- What a strategy is
- Why it’s important
- What to avoid
- What to aim for
I hope it helps you as much as it’s helped me!
What is a strategy?
“A detailed plan for achieving success in situations such as war, politics, business, industry, or sport, or the skill of planning for such situations” - Cambridge Dictionary
The key phrase here for me is “detailed plan.” I’ve always tried to make strategies as clear as possible. Clear often means a sufficient level of detail—so it sounds like I was on the right track.
Why is strategy so important?
Your product strategy drives alignment and coordination across your company. It ensures everyone pulls in the same direction at the same time. It’s about creating focus.
Imagine shipping a series of new features for a specific segment. Marketing campaigns are ready to go, customer success teams discuss them confidently, support teams are prepared to answer questions, and sales teams pitch to the new segments.
This resonates deeply with me and feels like exactly what I’ve been aiming for.
What makes a bad strategy?
Sometimes, it’s easier to start with what a strategy isn’t:
- It isn’t fluffy. Some people argue that strategies aren’t supposed to be actionable, painting vague pictures that leave you unable to take action. That isn’t ideal. If it isn’t actionable, it isn’t meaningful
- It isn’t financial metrics. Simply telling your teams to “increase revenue” isn’t a strategy; it’s a way to measure success. Instead, targeting X segment with Y value to achieve Z revenue—that’s a much better approach
- It isn’t how your teams collaborate. Explaining how teams work together isn’t strategy—it’s more about topology. Team topologies define the purpose and relationships of teams. They’re important, but don’t mistake them for strategy
If you’re into team topologies, check out this excellent post by Martin Fowler. It’s a fantastic read.
What makes a good strategy?
Surprisingly, the best write-up I found wasn’t from a product management source. It’s from Good Strategy, Bad Strategy by Richard Rumelt. You can grab it on Amazon for a great price.
Also, this Marty Cagan piece on product strategy is excellent.
So, what makes a good strategy?
- It identifies a series of problems or opportunities
- It’s written in the order you’ll tackle them
- Each problem/opportunity has a diagnosis. Breaking things down a little goes a long way
- It includes a series of actions for teams to enact
Additionally, a good strategy should:
- Be in plain English
- Have a “curator” or “owner”
- Be updated when new insights come to light
- Be re-communicated when changes are made
- Be an iterative document
- Be explainable by everyone across the company
- Move you toward your product vision
I plan to stick to this framework moving forward. Hopefully, it’ll allow me to keep refining my strategies for the better in the coming months!
17 Jul 2024, by Calum Shepherd
I recently came across these adages while browsing the web, and they resonated with me instantly—not just because one of them is from my favourite movie of all time!
- Murphy’s Law
- Gilbert’s Law
- Kidlin’s Law
- Wilson’s Law
- Falkland’s Law
Let’s explore each one and how you can apply them in your role as a Product Manager.
Murphy’s Law
“Anything that can go wrong will go wrong.”
“In some formulations, it is extended to: ‘Anything that can go wrong will go wrong, and at the worst possible time.’”
This may sound gloomy, but I’ve found it to be a helpful mindset—especially after first hearing it in Interstellar.
How to apply
- Expect Challenges. Working in software means recognising that not everything is within your control. While you can manage certain aspects, you often depend on others (e.g., usable designs, reliable code) to ensure success.
- Plan for Edge Cases. Invest time in planning. Consider potential issues by discussing designs and implementations with engineers, always keeping the customer perspective in mind.
- Stay Positive. When things go wrong (and they will), approach problems with energy and positivity. Engage the right people to address the issue. View setbacks as opportunities to learn rather than as failures.
Gilbert’s Law
“The biggest problem with any task or job is that no one tells you what and how to do it.”
Fun fact: Gilbert also happens to be my father-in-law’s name!
How to apply
- Be Organised. As a Product Manager, it’s your job to bring structure to ambiguity. Before diving into new work, take a moment to map out what’s needed to move from problem to solution.
- Communicate Clearly. Whether you’re using formal product development principles or a simple checklist, create a plan and share it with the right stakeholders. The plan can take as little as five minutes to draft, but its impact will be significant.
Kidlin’s Law
“If you write the problem down clearly, then the matter is half solved.”
I’m not sure where this adage originates, but it’s one of my favourites.
How to apply
- Define the Problem. Writing a clear, succinct problem statement is one of the hardest—and most crucial—tasks in product development. A well-defined problem helps prevent teams from jumping to solutions prematurely.
- Validate Understanding. Replay the problem statement to your colleagues and customers. Is it specific? Is this the exact issue you want to solve?
- Iterate Confidently. Once you’ve nailed the problem, you can start exploring solutions. Expect to discover new insights along the way—that’s part of the process.
Wilson’s Law
“Wealth is not an immediate goal but a byproduct of prioritising knowledge and intelligence.”
This might sound counterintuitive at first, but there’s more to it than meets the eye.
How to apply
- Focus on Growth. Your value as a Product Manager increases with experience. Take on challenges that push you outside your comfort zone, and you’ll open doors to new opportunities.
- Redefine Wealth. Wealth isn’t just about money. Roles that emphasise the product and people can be deeply rewarding. Also, don’t forget to prioritise what truly matters—like family and personal time.
Falkland’s Law
“Think about the things that are absolutely necessary.”
This adage is a game-changer for prioritisation.
How to apply
- Stay Focused. Once you’ve identified a specific problem, resist the temptation to tackle unrelated issues. Stay disciplined and solve the problem you set out to address.
17 Feb 2022, by Calum Shepherd
I wanted to share some thoughts on how our product management team has approached one of the most divisive topics in the product community - product roadmaps.
What was the aim?
Improve our current product roadmap so everyone across the business can understand what problems we intend to solve for users, in what order, and have some indication of when a customer might see these changes.
What problem were we looking to solve?
Over the past year, we made significant changes to our roadmap format, many of which were introduced at once. While there were positives, feedback on both the original and updated formats was, at times, conflicting.
To better understand these challenges, we started at the beginning. We ran a survey to gather opinions on what people liked and disliked about the current roadmap format.
What did we learn?
The survey revealed that people found the roadmap unclear. Specifically, we hadn’t struck the right balance between communicating:
- What we were working on
- When people might expect to see these changes
- Consistency in the level of detail provided
How did we action the changes?
We assumed that changing too much at once could create confusion. When solving multiple problems simultaneously, there’s always a risk of introducing new ones. To avoid this, we decided to work incrementally, starting with the existing format.
Our process
- Surveyed the business to gather likes and dislikes about the current roadmap.
- Held a session with senior management to understand their needs.
- Proposed and got approval for recommended changes.
- Collaborated with product managers to refine the updates.
- Communicated updates to the company and provided guidance on the new roadmap.
Roadmap qualities
We introduced several key changes to make the roadmap clearer and more actionable:
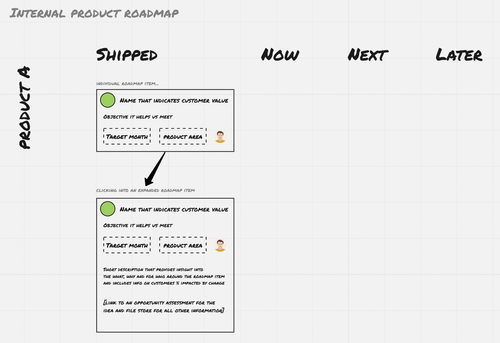
- Organised by “Now / Next / Later” to show when work will begin.
- Clearer titles focused on the value to customers.
- Alignment with objectives for better consistency with company goals.
- Consistent descriptions across all items.
- Statuses provided for each item (e.g., new idea, candidate, discovery, delivery, shipped).
- Indicative release windows (e.g., Q4 or March 2022) included on each card.
- Consistent granularity between items to improve readability.
- Links to opportunity assessments for evaluating the value of ideas.
Example internal roadmap

What about a public roadmap?
For now, our product roadmap remains internal, as the detailed information isn’t particularly useful for our customers.
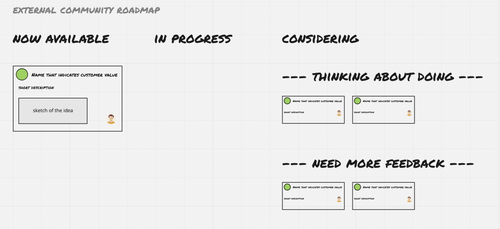
However, we’re working on an alternative public roadmap format for our community. This version will focus on gathering feedback to ensure we’re solving the right problems for our customers. Since the use case differs, so does the format.
Example public roadmap
- Organized by “Now Available / In Progress / Considering”
- “Considering” is further divided into “Thinking About Doing” and “Need More Feedback.”
- Simplified information on each card, with sketches of ideas for “Now Available” and “In Progress.”

What’s next?
The focus now shifts to listening to feedback and making further improvements. We’re also preparing to roll out the public product roadmap to our community in the near term—an exciting step forward!
C
11 Jan 2021, by Calum Shepherd
I tend to write notes from books or simply highlight passages as I go. While I read whenever I can, I don’t make a conscious effort to read regularly. This approach has worked for me in the past, but when life gets busy, my learning takes a back seat.
This year, I’m committing to reading one book every month. It doesn’t seem like much, but it should help me build a steady habit, think differently, and continue expanding my knowledge.
What’s on the list?
-
Michael J. Fox - No Time Like the Future
I’ve read Michael J. Fox’s other books, and his optimism always shines through. However, after a couple of setbacks, I’m curious to see how his perspective has evolved. This promises to be an emotive and insightful read.
-
Mapping Experiences: A Complete Guide to Creating Value through Journeys, Blueprints, and Diagrams
Miscommunication about mapping techniques is all too common in teams. For instance, an experience map that outlines how customers interact with your business differs from a story map. I’m hoping this book will sharpen my skills and help me choose the right tools at the right time.
-
Agile Product Management with Scrum
Roman Pichler’s previous book, Strategize, was a fantastic introduction to core product management concepts for alignment and direction. This book focuses on the practical application of those concepts in a Scrum environment. I’m looking forward to a valuable knowledge refresh.
-
User Story Mapping: Discover the Whole Story, Build the Right Product
Jeff Patton is a well-known figure in the Agile community, and I’m embarrassed to admit I haven’t read this yet. After going remote, I stopped using story maps, which is a shame. It’s time to revisit this tool, and this book will help me do just that.
-
Forever Employable: How to Stop Looking for Work and Let Your Next Job Find You

